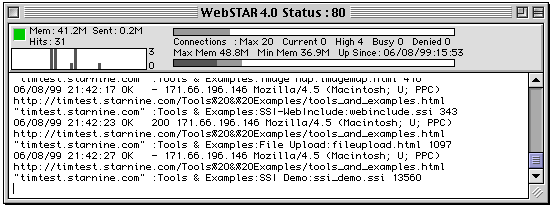
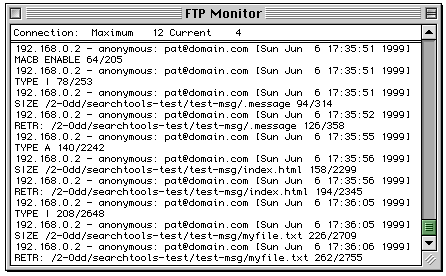
The WebSTAR Status window has two parts: a top panel which displays important information about the status of the server as a whole, and a monitor panel which displays initialization messages, error messages, and Web requests. The FTP, Mail and Proxy servers have separate monitor windows, so you can track those interactions as well.
The LED heartbeat gives you quick reading of the status. Slowly flashing green shows that the server is idle, flashing green shows it's busy, flashing red shows a connection refused, and solid red shows no connections accepted.
The title of the WebSTAR Server Status window shows you the web server port number ( 80 , by default) .
Some of these elements are also displayed in the Browser Admin Monitor page .
The text at the top left corner of the Status window displays the following information:
To change this setting, see Max Connections .
The current memory status is shown in the both memory meter bar and in the "Mem" status, described above.
The Zoom Box (
) on the right side of the title bar lets you toggle between standard and
minimized
modes of this window (as shown above). In minimized mode it will show you the heartbeat LED, the "Mem", "Sent", and "Hits" data, and the Load Histogram.

Log monitoring of HTTP requests and responses is only displayed in the monitor panel when the Status window is at the standard size: the data is not stored when the window is minimized. However, log data is always stored in the log file.
To speed up your server's responses, keep this window closed and use the Admin Status Window.
The Web Monitor pane (below the Server Status Panel) displays server initialization data, error messages, and Web server HTTP and HTTPS requests and responses.

On initialization, you'll see copyright information, status, and initialization information.
These messages are not stored in the log file or displayed in the Admin monitor windows.
PowerPC (CW) Server is running on port 80.
WebSTAR Virtual Hosts
==============================
* knickknacks.domain.com * -> :kkn:
* www.tchotchkeys.com * -> :tch:
* widgests.domain.fr * -> :mechanisme:
192.168.0.4 * es -> :cositas
192.168.0.4 * fr -> :mechanisme:
* widgets.domain.com * -> :widgets:
* www.domain.com * -> :widgets:
192.168.0.4 * * -> :widgets:
192.168.0.3 * * -> :kkn:
Initialized Plug-ins:
=====================
WebSTAR Virtual Hosts 4.0
WebSTAR SSI-WebInclude 4.0
WebSTAR SSI 4.0
WebSTAR Search 4.0
WebSTAR QuickDNS Load Balancer 4.0
WebSTAR Mail 4.0
WebSTAR Log Archiver 4.0
WebSTAR Lasso Publisher 4.0
WebSTAR JRun Servlet Runner 4.0
WebSTAR Image Map 4.0
WebSTAR FTP 4.0
WebSTAR Form Mail 4.0
WebSTAR File Upload 4.0
WebSTAR Directory Indexer 4.0
WebSTAR Data Cache 4.0
WebSTAR Byte Server 4.0
WebSTAR Admin 4.0
File Info Caching is enabled with space for approximately 41 entries.
Persistent Connection processing is enabled.
WebSTAR Lasso Publisher: Loading Tag Modules
Loaded " Lasso_Tags.mod" module successfully.
Loaded "DB_Info_Tags.mod" module successfully.
WebSTAR Lasso Publisher: 4/22/1999 1:45:43 PM New Lasso Tag Parser is ON.
Loaded "NewParser_On.mod" module successfully.
WebSTAR Lasso Publisher: Loading DataSource Modules
Loaded "FM_DataSource.mod" module successfully.
Loaded "Send_Mail_DataSource.mod" module successfully.
Load Balancing for FTP turned off
!!LOG ARCHIVER: Log archiving for WebSTAR Web server is scheduled to run daily
!!LOG ARCHIVER: and will next occur on 04/23/1999 at 11:00 AM.
!!LOG ARCHIVER: Log archiving for WebSTAR FTP server is disabled.
!!LOG ARCHIVER: Log archiving for WebSTAR Proxy server is disabled.
!!LOG ARCHIVER: Log archiving for WebSTAR Mail server is scheduled to run hourly
!!LOG ARCHIVER: and will next occur on 04/22/1999 at 03:00 PM.
Most of the data in the Status window Monitor Panel will be requests using the HTTP protocol. For example, the line:
06/01/99 19:18: 200 OK 200 leslie.domain.com Mozilla/4.5 (Macintosh; U; PPC) "www.example.com" :knickknacks:index.html

is in the default format (see WebSTAR Log Format ). It shows that on June 1, 1999 at 7:18 pm, the server sucessfully returned a file to the browser on the machine "leslie.domain.com", that the browser was Netscape version 4.5 for the Mac, that the host requested was www.example.com and that the file served was named index.html and stored in the knickknacks folder.
This information is also stored in the Web Log file (see Logging ).
When you change your log file format, the monitor window will change too. For more information, see Log Formats .
If your server has errors, you'll see an entry with " ERR! " in the Monitor Panel. If the server cannot find a file, or there's a problem with Plug-In that should handle a URL, it will display information about these errors. For more information, see Chapter 14: Web Server Troubleshooting.
As you use more Plug-Ins and CGIs, the messages in this window will be more complex, but they are designed to help you understand what is going on and how to best configure your server.
If you're having trouble with your server, you can specify more detailed messages by selecting Verbose Messages .
The FTP monitor window shows you information about current connections in the top panel. The monitor panel shows logins, uploads, downloads, and errors. For complete information, see FTP Monitors & Logging .

The Mail monitor window displays all mail transactions, including logons, logoffs, incoming and outgoing messages, LDAP requests and so on. It does not show the connections or queue information, although the Admin Mail Monitor window shows that information.
For more information, see Mail Monitor & Queue Window .

The Proxy monitor window displays information about connections and caching. The logging panel displays each transaction, with information about the URL and the cache status. For complete description, see Proxy Status Window & Log File .