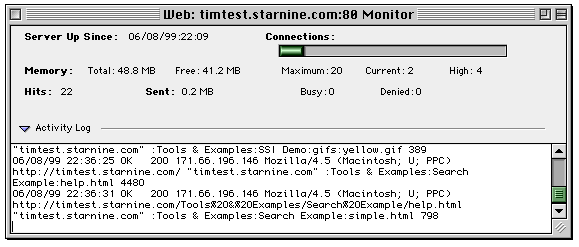
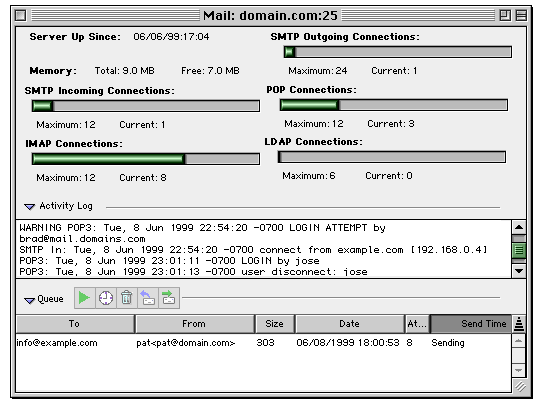
The WebSTAR Admin monitor windows contain much the same information as the server monitor windows. Each window title includes the server type (Web, FTP, Mail or Proxy), the host name or IP address (from the Connection dialog), and the port number.
The server monitor windows themselves contain a status pane and a log entry pane. Most of the information in these windows is the same as in the WebSTAR Status and Monitor Windows .
The Server Up Since number is updated while the Admin is connected: when the Admin is disconnected due to a timeout, that area says "Server Not Available".
You can use the mouse to select text, then copy it to the Clipboard and paste to a text editor.
The WebSTAR Admin Web monitor window is somewhat different from the server Web monitor window. The Status pane is much like the Status Window Top Panel , although it does not have the histogram, LED, or "high-water marks" in the Connections and Memory bars.
The monitor window is similar to that of the server: see Web Server Monitoring and Log Formats for details.

The FTP monitor is much like that of the server. The status pane displays a Connections bar indicating the percentage of available connections now in use, the maximum possible connections and the current number of connections. The logging pane below it shows the actions of the FTP server, including client logins, file transfers and so on.
For more information, see FTP Monitors & Logging .

The Mail Monitor shows how many connections are currently in use, the log of the most recent mail transactions, and the items in the queue waiting to be sent.
For more information, see Mail Monitors, Logs, and Reports .

The Proxy monitor is much like that on the server. The status pane displays the number of bytes sent, the number of files matched in the cache, a bar indicating the percentage of connections used, the maximum number of connections and the current number of connections. Below it, the log pane shows the date, time, HTTP status, requesting browser's IP address, URL, Proxy Cache status (Hit, Miss or Pass), bytes transferred and time taken.
For more information, see Proxy Status Window & Log File
